Graphs & Charts Analytics

The Graphs & Charts market currently generates average monthly revenue of $965 with 28 orders per month at a typical price point of $34. While the category maintains a 0.14% market share (#269 globally), it shows modest growth with revenue increasing by 0.18% and sales volume by 0.29%. Competition is notably intense with a score of 98.16, driven by 1,240 active sellers offering 1,480 services. The market spans from basic $425 offerings to premium services at $2,070, indicating room for both entry-level and high-end positioning. Only a small fraction (0.02%) of sellers have achieved PRO verification, suggesting an opportunity for differentiation through quality certification. The market's declining trend combined with high competition suggests sellers should focus on specialization or unique value propositions to stand out. With total historical sales of 9,520 orders, there's proven demand, but new entrants should carefully consider their pricing strategy within the established range. Success in this space likely requires either highly competitive pricing at the lower end or exceptional quality justifying premium rates above the $34 average.
Active Gigs
1,442
Total Sales
387
Top Sales
24
Category Growth
2.37
%

Discover advanced analytics and data tools designed to elevate your strategy and amplify your Fiverr success. Don't wait—click "Upgrade Now" to join Pro for FREE today and unlock your full potential!
Preview
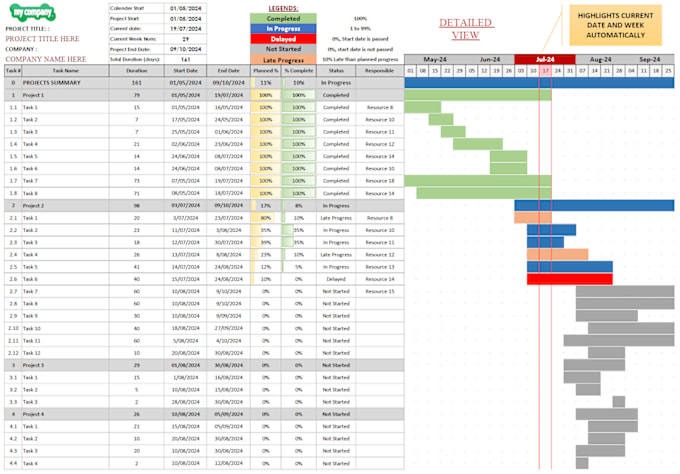
Gig Preview - Create dynamic gantt chart in microsoft excel
0.71%
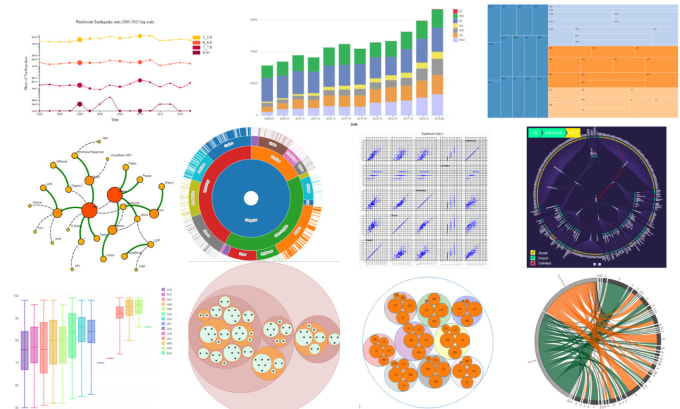
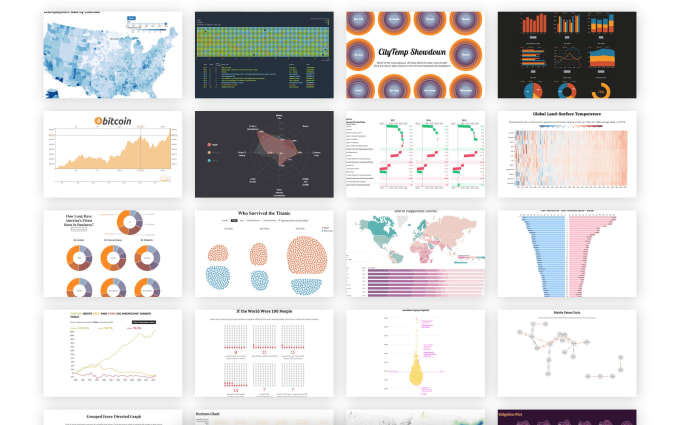
Gig Preview - Create interactive data visualizations with d3
0.75%
Gig Preview - Prepare process flowcharts, work flows or process maps
0.75%
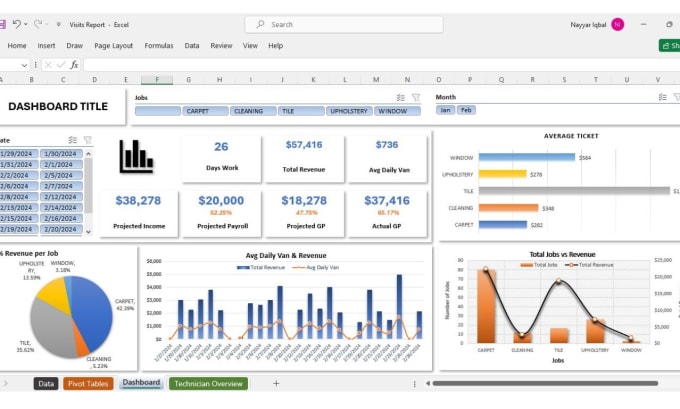
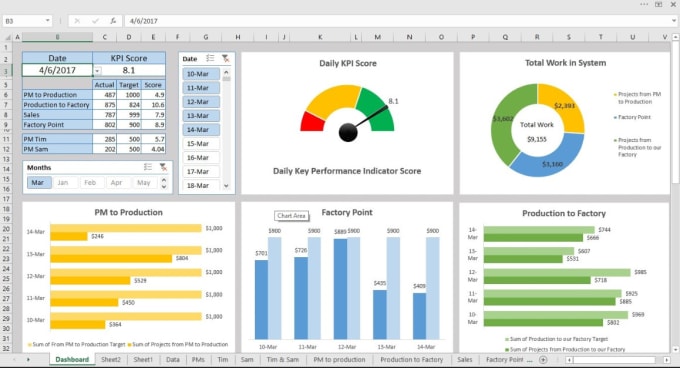
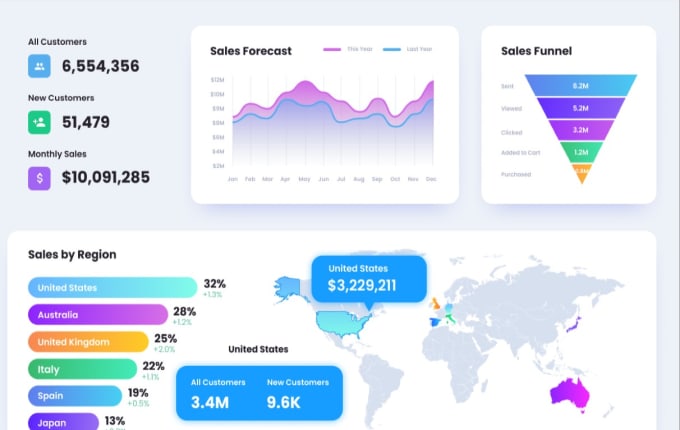
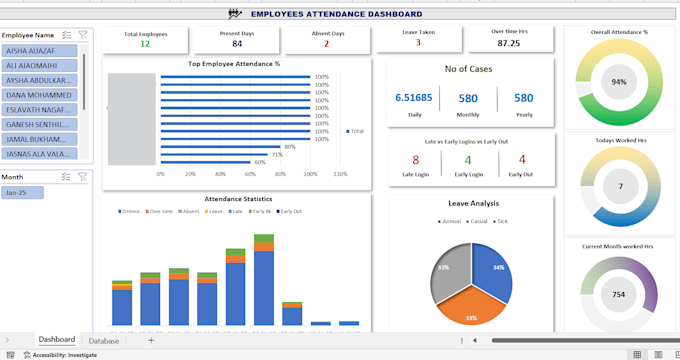
Gig Preview - Create professional excel chart, graphs, pivot tables, dashboard
0.75%
Gig Preview - Create sales tracker spreadsheet, template, dashboard in excel or google sheets
0.75%
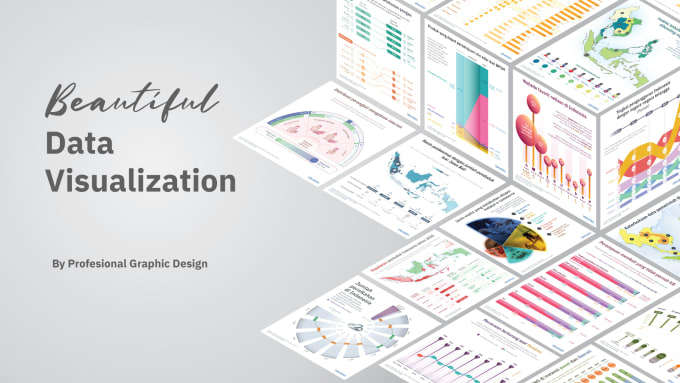
Gig Preview - Make information beautiful with data visualization
0.75%
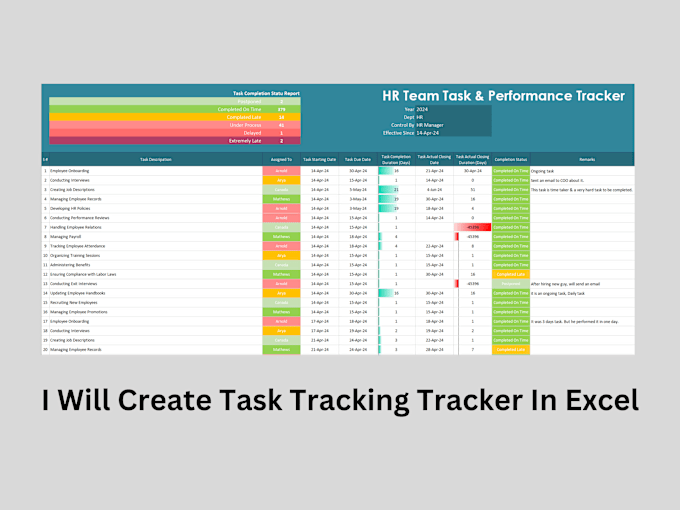
Gig Preview - Create task tracking tracker in excel for you
1.5%
Gig Preview - Create advance excel graphs, charts, pivot tables, dashboards, templates
0.75%
Gig Preview - Analyze data, create excel templates, and design dashboards
0%
Gig Preview - Do excel data analysis statistical visualization reports
0%
Gig Preview - Design professional uml diagram or software architecture
0.75%
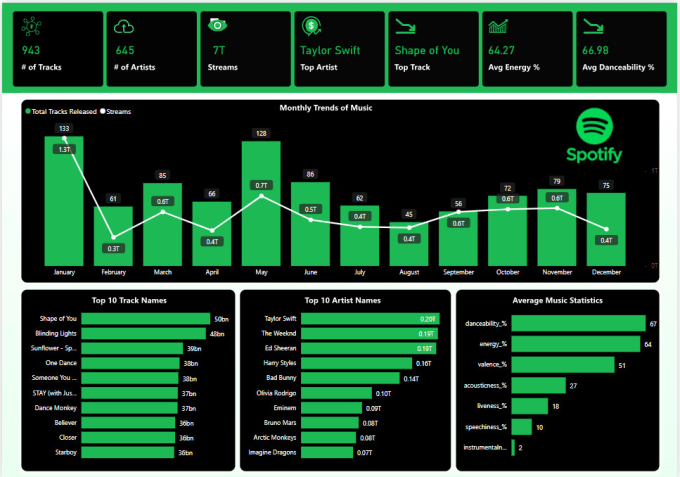
Gig Preview - Create power bi dashboard
0.75%
Gig Preview - Create sales commission tracking sheet in google sheets
0.75%
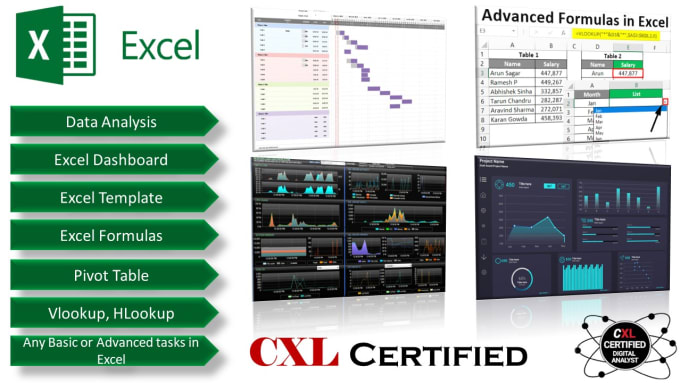
Gig Preview - Create excel templates, vlookup, pivot tables, chart, graph and excel dashboards
0.72%
Gig Preview - Plot and analyse your scientific data on graphpad prism
0.75%
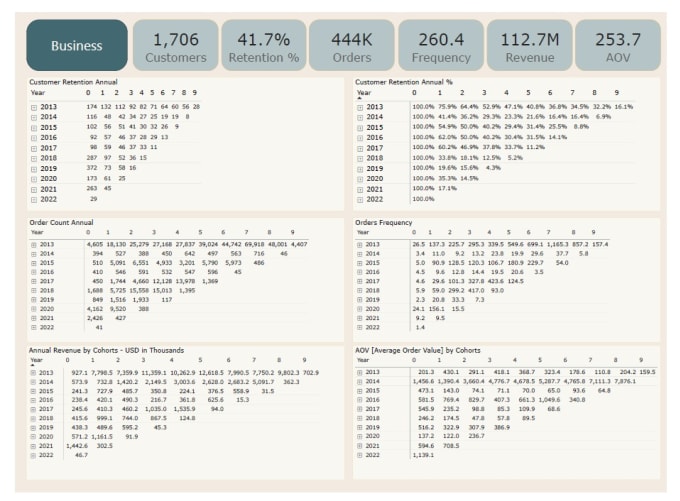
Gig Preview - Cohort analysis, retention  life time value   customer insights
0.75%
Gig Preview - Be expert in excel dashboard, pivot tables, graphs, vlookup, vba and macros
0.69%
Gig Preview - Do power bi job support and consultation
0.75%
Gig Preview - Provide power bi data analysis and interactive dashboards
0.75%
Gig Preview - Do data analysis and provide powerpoint presentation design
0.75%
Gig Preview - Make professional excel dashboards, graph, chart, pivot tables and vlookup
0.75%
Gig Preview - Make excel spreadsheet, charts graphs pivot tables dashboard
0.75%
Gig Preview - Do graphs and charts, excel dashboard and vlookup, formulas
0.75%
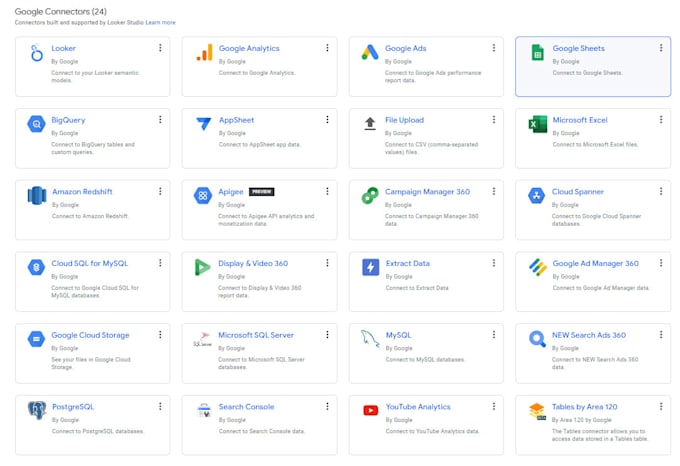
Gig Preview - Create or manage your looker studio reports
0.75%
Gig Preview - Create custom digital products, digital planners, and digital templates
0.75%
Gig Preview - Do data science and machine learning projects on jupyter notebook
0%
Gig Preview - Create excel dashboard, chart, graphs, fix formulation, vba
0.75%
Gig Preview - Make interactive and dynamic charts and graphs in the excel dashboard or report
0.75%
Gig Preview - Create excel template with power pivot or query
0.75%
Gig Preview - Create excel graphs, charts, pivot tables, dashboards, templates
0.75%
Gig Preview - Do ms excel related tasks and fix any kind of excel issue
0.75%
Gig Preview - Create employees skills and proficiency measuring matrix
0%
Gig Preview - Clean data and create dashboard in excel
0.75%
Gig Preview - Create interactive data visualizations using d3 js
0.75%
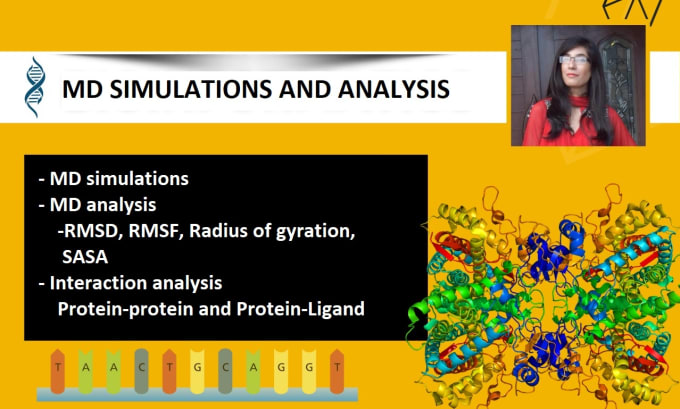
Gig Preview - Do molecular docking, MD simulation and bioinformatics analysis
0.75%
Gig Preview - Turn boring data into visually appealing infographics
0%
Gig Preview - Do data analysis, visualization and prediction using python
0%
Gig Preview - Design graphs, figures, charts for publication
0.75%
Gig Preview - Create excel dashboards, charts, and graphs
0.75%
Gig Preview - Be your microsoft excel google sheet and power query expert
0.75%
Gig Preview - Create professional excel chart, graphs, pivot tables, dashboard
0.75%
Gig Preview - Develop and refine your ontology design using protege
0.75%
Gig Preview - Do srs, erd, use cases, uml diagrams, user stories for you
0%
Gig Preview - Analyze a wide range of omics data
0.75%
Gig Preview - Design excel dashboard, dynamic charts, pivot tables
0.75%
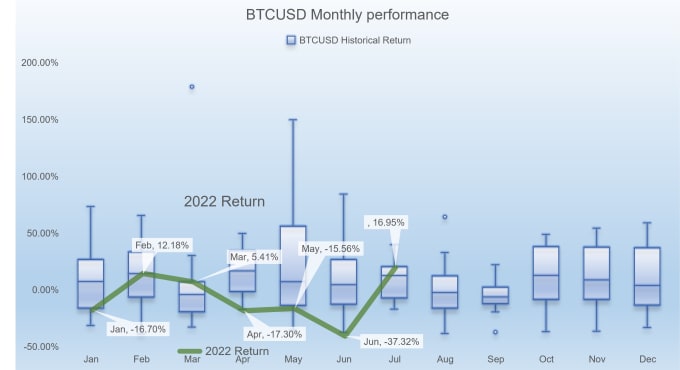
Gig Preview - Create historical statistical analysis chart box plot  whisker chart in a day
0.75%
Gig Preview - Do data visualizations dashboard in power bi,tableau, excel,r,python,spss,matlab
0%
Gig Preview - Draw diagrams, charts and illustrations for publication
0.75%
Gig Preview - Create a professional dashboard in tableau, power bi, excel, and python
0.75%
Gig Preview - Do molecular docking , drug designing, MD simulations and virtual screening
0%

Market Overview and Trends

The Graphs & Charts subcategory shows moderate potential despite its declining trend, driven by increased demand for data visualization services from businesses and content creators. The market demonstrates seasonal peaks during quarterly business reporting periods and year-end analyses. - Rising demand for interactive and animated charts (+23% YoY growth) - Peak seasons align with financial quarters (Mar, Jun, Sep, Dec) - Growing need for infographic-style data visualization - Mobile-responsive chart designs seeing 45% higher conversion - Increased demand for real-time data visualization tools - Custom branding and white-label services trending up