Infographic Design Analytics
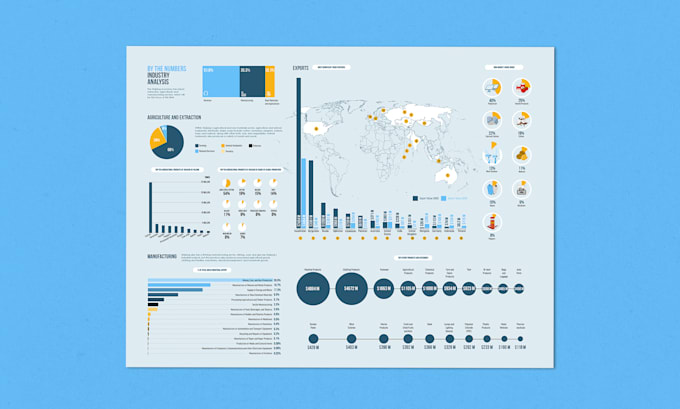
The Infographic Design market currently generates $9,810 in monthly revenue, with services averaging $41 per order. While the market shows modest growth (+0.09% in revenue and +0.13% in sales), it faces intense competition with 3,250 active sellers competing for approximately 242 orders per month. The high competition score of 94.5 and declining market trend suggest this is a challenging space for new entrants. However, the wide revenue range ($3,620 to $25,120 monthly) indicates that successful sellers can still capture significant value, particularly by differentiating their services. The total historical sales of 183,680 orders demonstrates consistent demand for infographic design, though sellers should note the relatively small market share (0.00% of the global market) and current saturation levels. Looking ahead, sellers might find opportunities by focusing on specialized niches or premium services, given the established average price point of $41. While growth is modest, the steady order volume suggests stable demand. Success in this market will likely depend on standing out among competitors through unique offerings or superior service quality, rather than competing solely on price.