Reports Analytics

Market Summary - Reports Category The Reports category represents a stable but highly competitive market with over 700 active sellers generating an average monthly revenue of $215 per seller. With an average service price of $54 and typical monthly sales of 4 orders per seller, this category maintains a modest 0.02% market share. The total market has reached 3,800 historical orders, indicating consistent demand. Current trends show slight but positive growth, with revenue increasing by 0.06% and sales volume growing by 0.11%. However, the extremely high competition level (99.54 score) suggests sellers need to differentiate their offerings to succeed. The wide revenue range ($80-$400 monthly) indicates opportunities exist for both entry-level and premium service providers, though new sellers should note that only a small percentage of providers achieve PRO verification status. Looking ahead, the stable growth patterns and consistent order volume suggest this market will likely maintain its current trajectory, with potential for modest expansion as business reporting needs continue to evolve.

Active Gigs
813
Total Sales
142
Top Sales
8
Category Growth
1.82
%

Discover advanced analytics and data tools designed to elevate your strategy and amplify your Fiverr success. Don't wait—click "Upgrade Now" to join Pro for FREE today and unlock your full potential!

Preview
Gig Preview - Create custom reports for fishbowl inventory system
0.76%
Gig Preview - Create and design a high quality impact report
0.75%
Gig Preview - Develop professional salesforce reports and dashboards for sales mktg or custom
0.75%
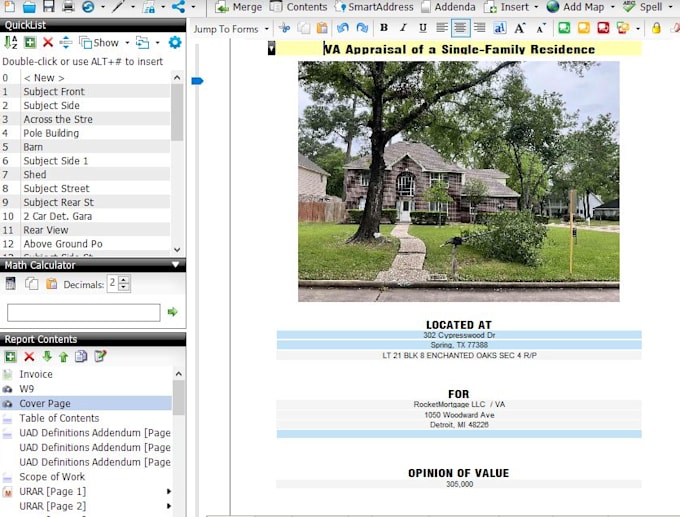
Gig Preview - Create appraisal reports and appraisal assistance
0.75%
Gig Preview - Scan your entire website using screaming frog SEO spider and deliver a report
0.72%
Gig Preview - Do real estate appraisal reports and property valuation
0.75%
Gig Preview - Help in data analysis and report for both qualitative and quantitative research
0.75%
Gig Preview - Create business intelligence reports using qlik, power bi and nprinting
0%
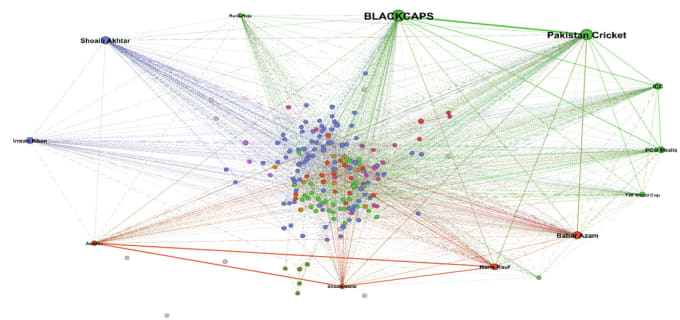
Gig Preview - Do social network analysis in gephi, python, and networkx
0.75%
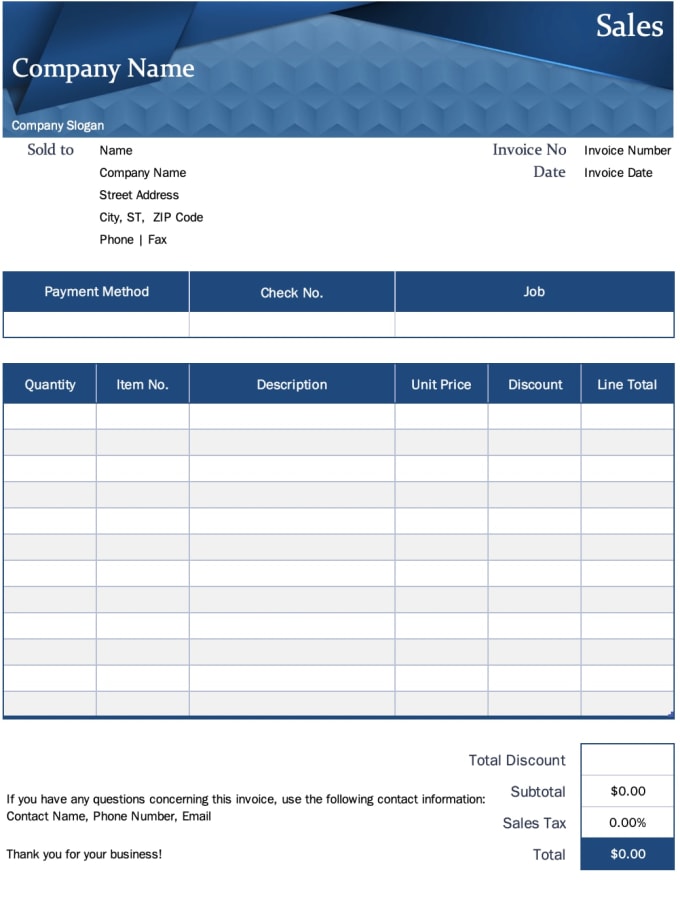
Gig Preview - Generate sale order invoices, sale receipts, sale orders, delivery note
0.75%
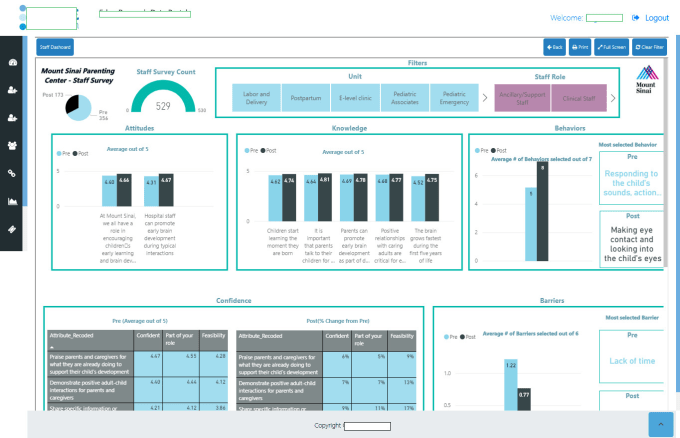
Gig Preview - Design professional power bi dashboards
0.75%
Gig Preview - Create power bi dashboard and reports for you
0.75%
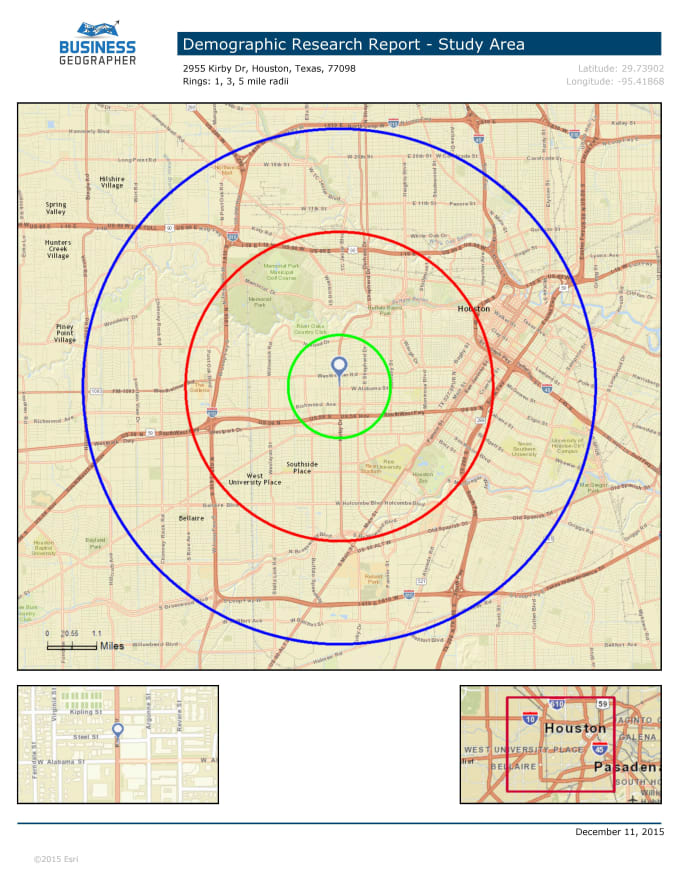
Gig Preview - Provide a detailed demographic radius report
0.75%
Gig Preview - Do excel spreadsheets, which includes vlookups, and pivots
0.75%
Gig Preview - Draw data flow diagrams, erd, dfd, flow charts
0.75%
Gig Preview - Create rls based power bi embedded dashboard
0.75%
Gig Preview - Scan your entire website using screaming frog SEO spider and make a report
0.75%
Gig Preview - Do payroll budget vs actual excel template
0%
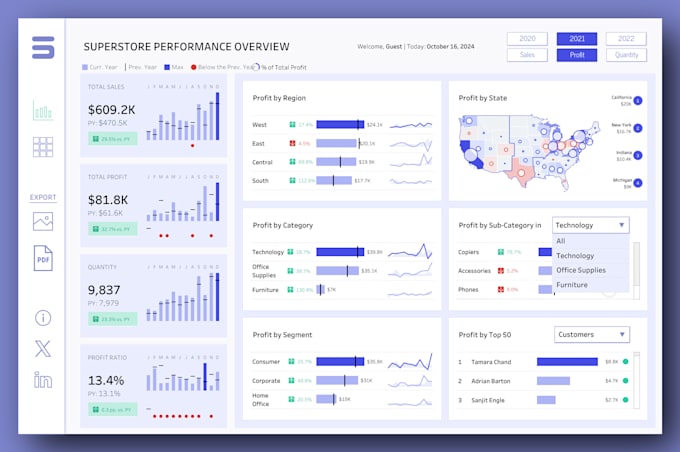
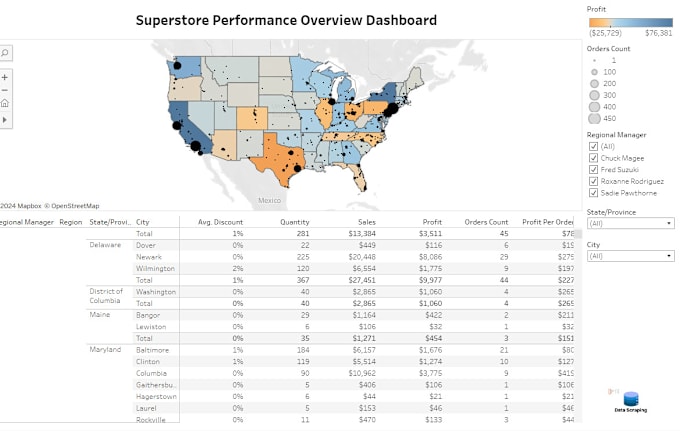
Gig Preview - Make data analysis, data analytics, and business intelligence reports on tableau
0.75%
Gig Preview - Create custom power bi dashboards and reports
0.6%
Gig Preview - Help you with ibisworld report
0.75%
Gig Preview - Create diagrams, flowchart and organogram on ms visio
0.75%
Gig Preview - Design solar energy systems
0.75%
Gig Preview - Create power bi dashboards and reports
0.75%
Gig Preview - Develop, modify or fix your ssrs reports
0%
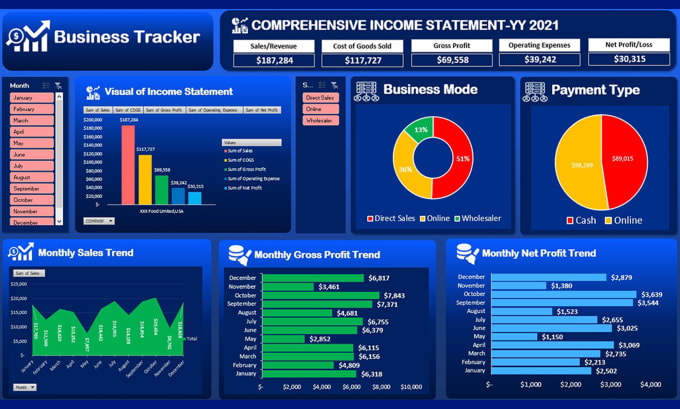
Gig Preview - Create an interactive data visualization dashboard in excel or google sheets
0.75%
Gig Preview - Run demographic reports with maps for US locations
0.75%
Gig Preview - Design impactful tableau reports with meaningful metrics
0.75%
Gig Preview - Do data science, analysis machine learning project in python jupyter notebook
0%
Gig Preview - Develop custom reports for microsoft dynamics 365 business central
0.75%
Gig Preview - Prepare your budget vs actual report by using excel tips
0.75%
Gig Preview - Create a professional power bi dashboard for data analytics
0.75%
Gig Preview - Crear reportes en power bi
0.75%
Gig Preview - Create a power bi report for you
0%
Gig Preview - Create custom structural engineering excel spreadsheet
0%
Gig Preview - Complete any project management assignment raci, gantt, charts, overviews
0.75%
Gig Preview - Create interactive power bi report and dashboard
0.75%
Gig Preview - Make professional purchase receipts made to perfection
0.75%
Gig Preview - Personalize google sheets budget plan for your store online
0.75%
Gig Preview - Design advance ssrs report
0.75%
Gig Preview - Create new crystal report, ssrs report for you
0%
Gig Preview - Create, modify, customize your sap crystal reports
0.75%
Gig Preview - Compile your excel file,create graphs,pivot table,vlook up
0.75%
Gig Preview - Do any database and website extraction
0
0%
Gig Preview - Design professional and interactive reports in tableau
0
0%
Gig Preview - Design excel invoice template
0
0%
Gig Preview - Develop jasper reports, ireport and jasperreports server
0
0%
Gig Preview - Make vpat report  of your website with wcag level a aa
0
0%
Gig Preview - Create google analytics dashboard with data studio
0
0%
Gig Preview - Automate your excel reports using power bi
0
0%

Market Overview and Trends

The Reports subcategory demonstrates steady growth potential with a focus on business intelligence, market research, and data analysis services. The moderate market share indicates room for expansion while maintaining profitable operations for established sellers. - Rising demand for industry-specific market research reports (+15% YoY) - Growing interest in data visualization and interactive reporting formats - Increased buyer preference for comprehensive analysis packages - Seasonal peaks during Q4 and Q1 fiscal planning periods - Strong demand from startups and SMEs seeking market insights