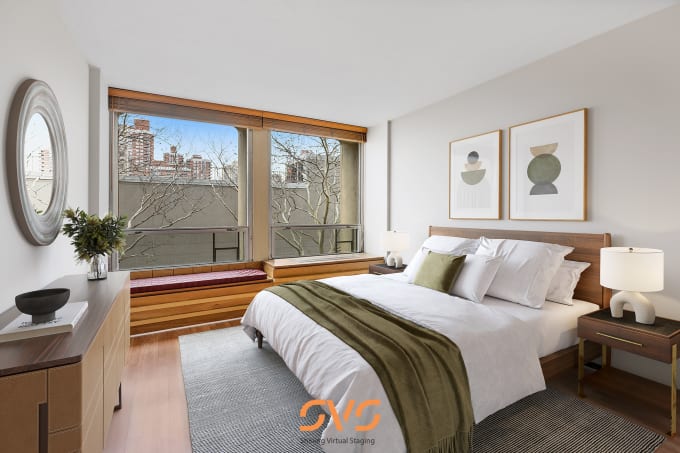
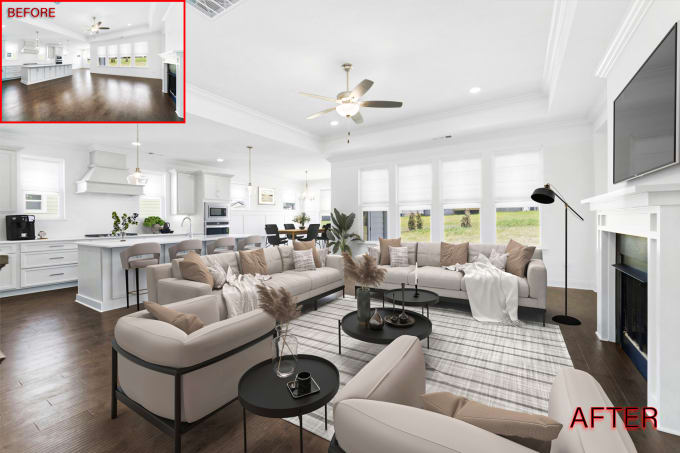
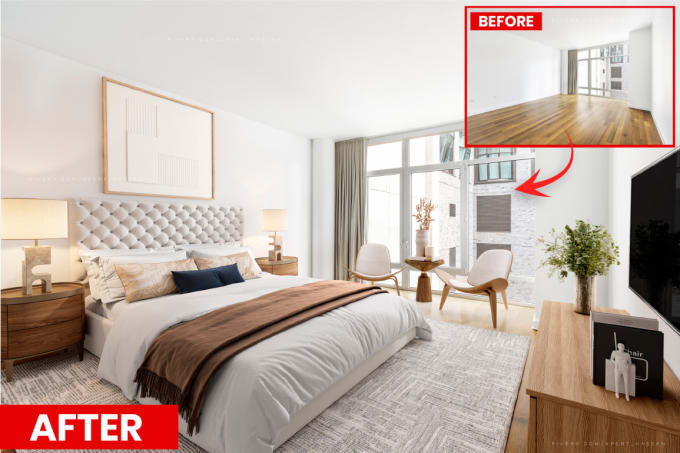
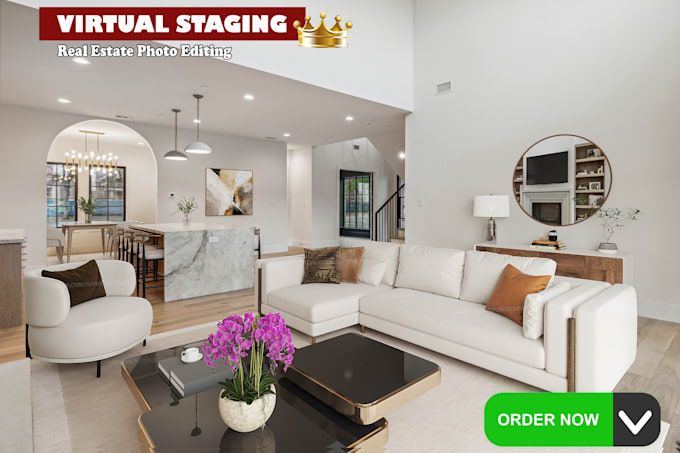
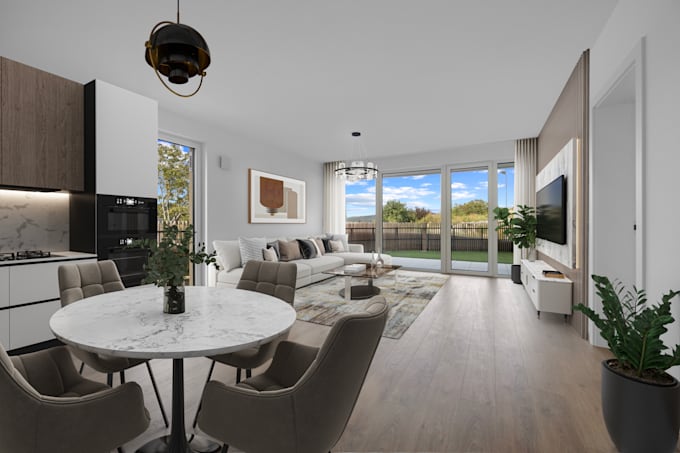
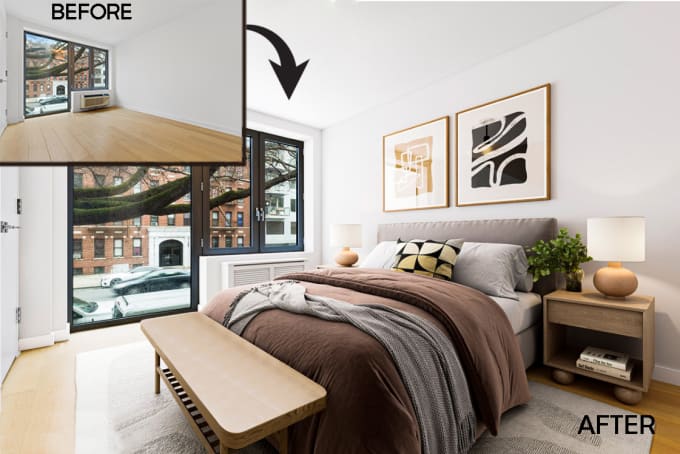
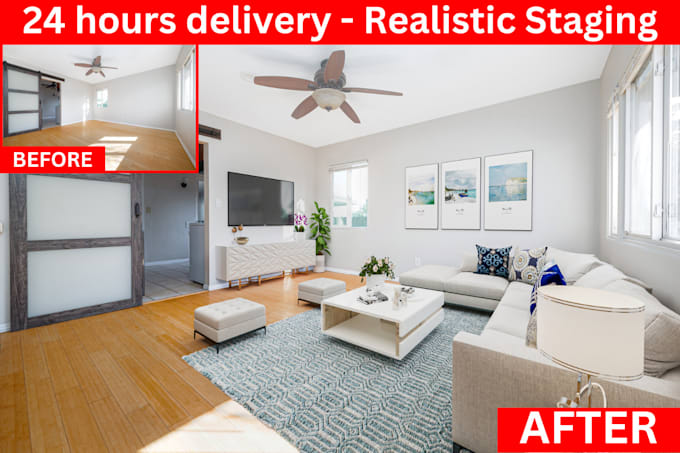
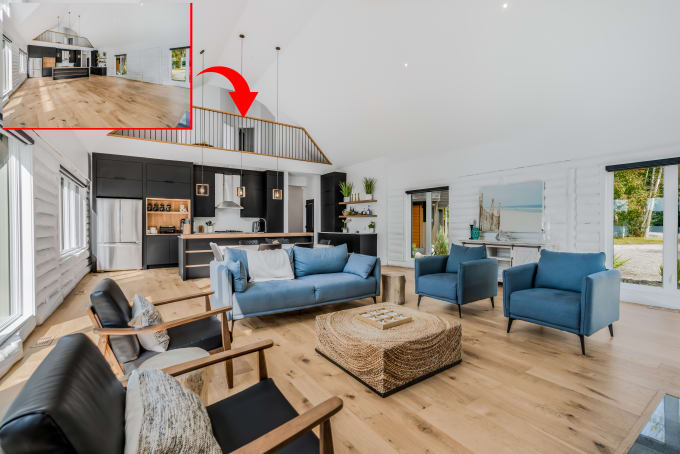
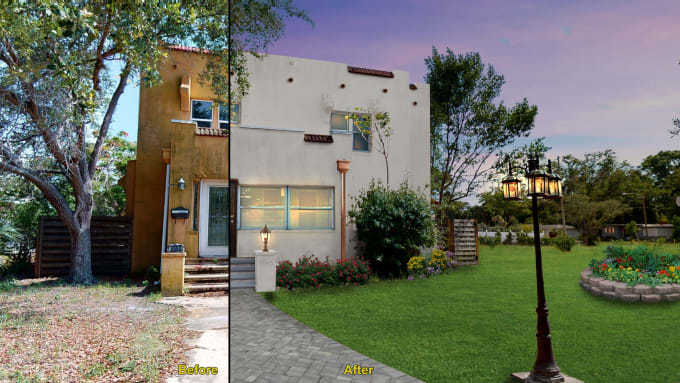
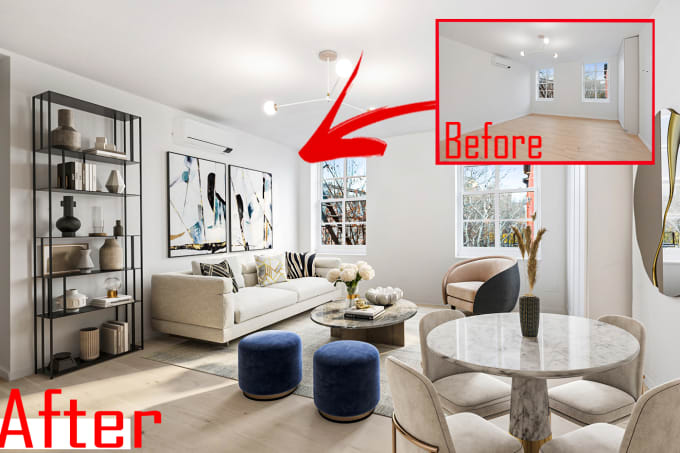
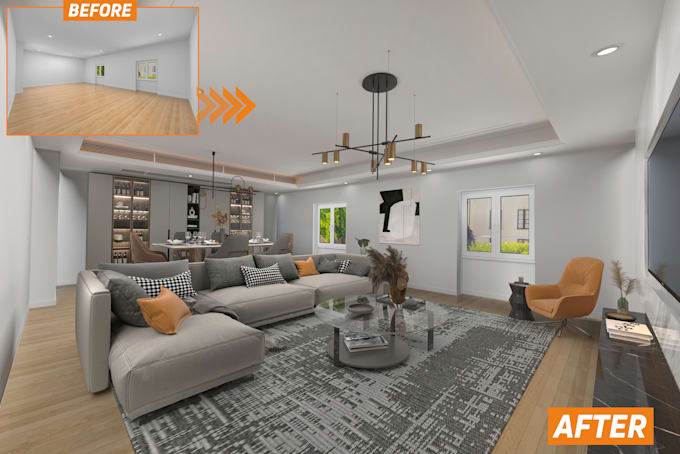
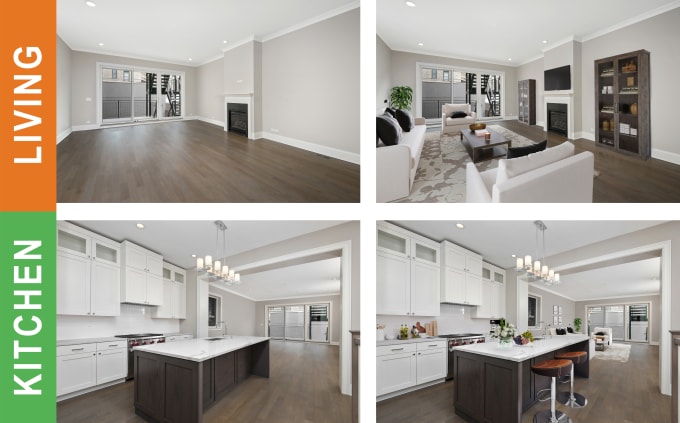
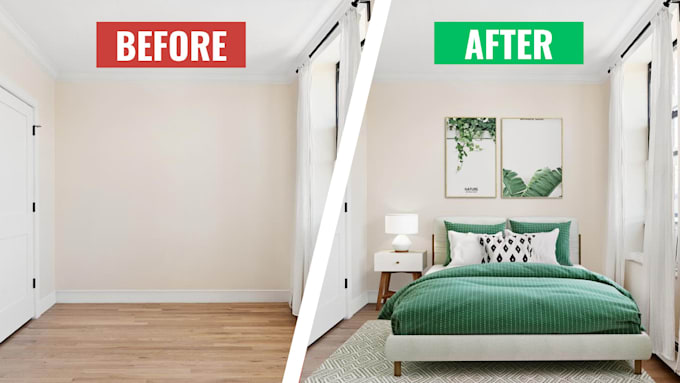
Virtual Staging Analytics
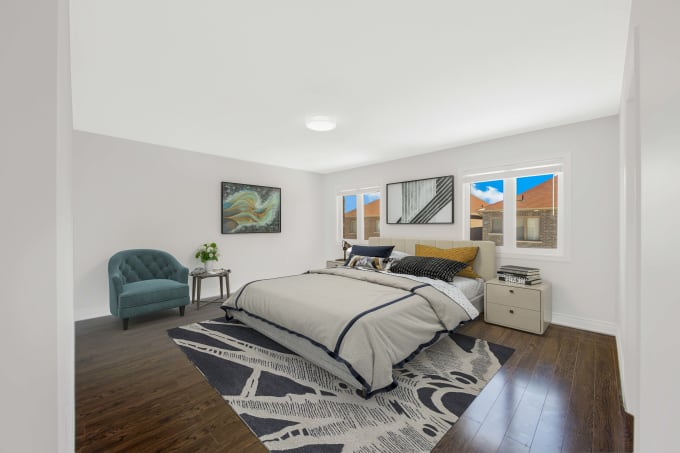
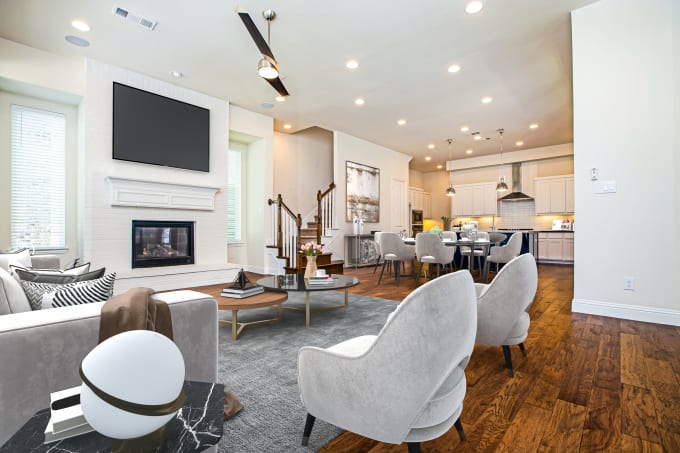
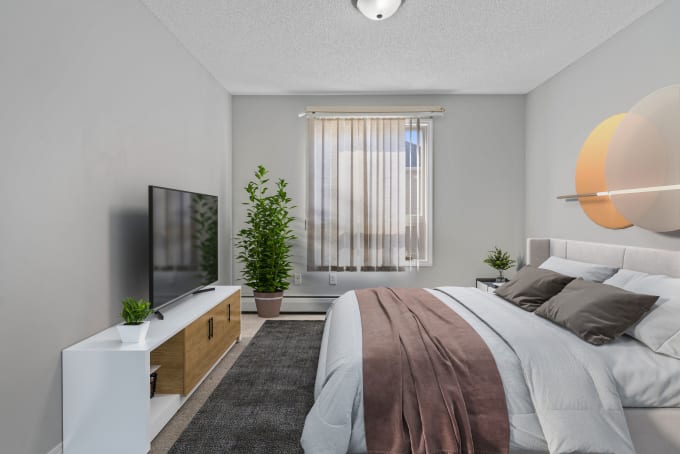
The Virtual Staging market currently generates $7.70K in average monthly revenue, with service prices averaging $51.00 per order. While the market maintains a modest +0.23% revenue growth rate, competition is notably intense with 635 active sellers competing for approximately 150 monthly orders. The market share stands at +0.03% globally, ranking #152 among digital service categories. The high competition level (86.21 score) and relatively slow growth suggest a mature market that's approaching saturation. With 927 active services being offered and total historical sales of 58.61K orders, new sellers should focus on differentiation and quality to stand out. The revenue range of $1.68K to $13.96K per month indicates that while some sellers are finding success, many may be struggling to capture consistent business in this crowded space. Looking ahead, the market shows signs of stabilizing rather than expanding significantly. The modest growth in both revenue (+0.23%) and sales volume (+0.26%) suggests that future opportunities may lie in specialized niches or premium services rather than general virtual staging offerings. Sellers entering this market should consider developing unique value propositions or targeting specific real estate market segments to compete effectively.