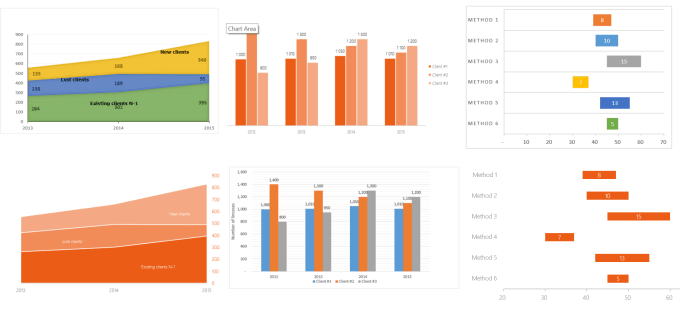
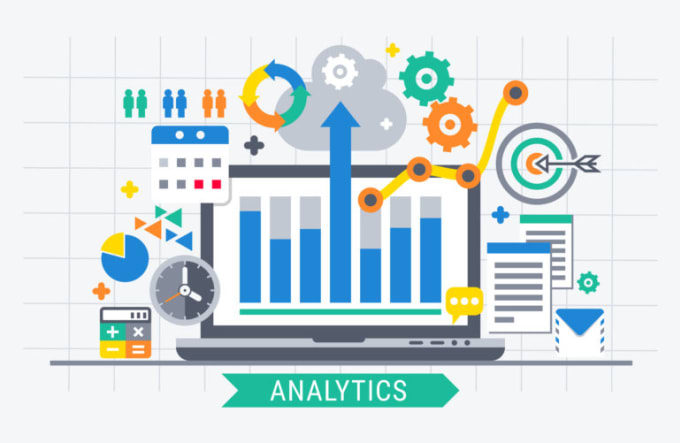
Data visualization using excel graphs and charts Analytics
Analyze 'I will data visualization using excel graphs and charts' on Fiverr and uncover key insights to optimize your service. This gig has captured a market share of 0.00 in its category, generating $585.00 in total revenue. Over the last 30 days, 'I will data visualization using excel graphs and charts' experienced 0.00% growth in sales, generating $0.00 in revenue. Compare with similar gigs like 'I will build automated and interactive report on power bi', 'I will build automated power bi dashboards, power bi reports, power bi templates, dax', and 'I will automate distance calculation with google maps API and arcgis' With an average price of $45.00 and high demand, 'I will data visualization using excel graphs and charts' offers a great opportunity for freelancers.
(10 ratings)
Sales: 0
Category: Data
Subcategory: Data Visualization
Nested subcategory: Graphs & Charts
Jayanti007 All Gigs and Services


Data visualization using excel graphs and charts Keywords
Data visualization using excel graphs and charts Category Keywords
Data visualization using excel graphs and charts Similar Gigs


Data visualization using excel graphs and charts More Gigs
Top Revenue-Generating Categories
Unlock the secrets behind 'I will data visualization using excel graphs and charts's success. This service dominates its niche with a total market share of 0.00 and a steady revenue growth trend of 0.00% over the last 30 days. Sellers offering similar gigs have strategically priced their services between $45.00 and $70.00, making 'I will data visualization using excel graphs and charts' a competitive yet lucrative option. Explore related gigs such as 'I will build automated and interactive report on power bi' and 'I will build automated power bi dashboards, power bi reports, power bi templates, dax' for insights on how to optimize your own offerings. With SayJam's data, you can adapt, compete, and grow your presence in the Fiverr marketplace.